Welcome to A Tale of Two Cities.

After the final game of the 2017-2018 English Premier League season, Manchester City FC had obliterated a number of records. They had won the league with five (5) games remaining and along the way set records for most points (100), most wins (32), most goals (106), greatest margin of victory (19 points ahead of second place Manchester United) and a host of more tactical and esoteric records.

Heading into the 2018-2019 season, it was hard to imagine anyone challenging this record-breaking team. They were just so impressive.

As the 2018-2019 season came to a close, Manchester City had indeed won again; but by a single point ahead of Liverpool, who had finished fourth the season before. To finish ahead of Liverpool by that single point, Manchester City had to win their final 14 matches. They also matched their record of most wins (32) set the season previous. Liverpool finished with the highest point total of any previous runner up.

A truly remarkable and entertaining couple of years. We can only hope the 2019-2020 season will be equally thrilling.

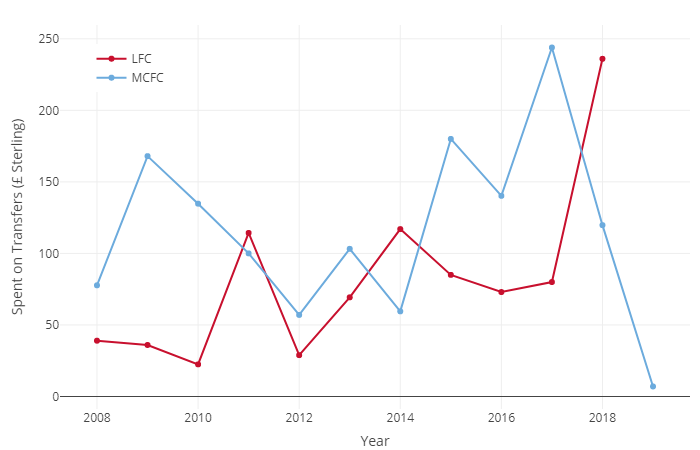
The purpose of this site is to collect and publish information and analysis regarding this competitive environment. We wanted to understand how this incredible Manchester City team had been built and how Liverpool compared.

We will not be exploring much in the way of tactical information. Team formations, passing accuracy, distance covered and other such data, we leave to the many, many people infinitely more qualified to judge such matters. Our desire is to find data that will help us gain some situational awareness and context for the challenge between Liverpool and Manchester City. Particularly, financial data and understanding how these two teams have approached success.

Another purpose of this project is to expand our knowledge of the R programming language and some other technologies. We will endeavor to keep technical material clearly separated so as not to overwhelm those that are here for a good read.

The period we chose to analyze is from the 2007-2008 season onwards. The reasons for this are somewhat arbitrary. In 2008, Manchester City was purchased and is now run by, Abu Dhabi United Group; representatives of the sovereign wealth of the United Arab Emirates. We fully expected to see an increase in investment after this acquisition but lacked details. We hope we are presenting acceptable details here.

2007-2008 season was also the year that Manchester City signed Vincent Kompany (their captain for the 2018-2019 season). This seemed like an appropriate bookend to us, although since this project began, Mr. Kompany has announced his departure from Manchester City.

We hope you enjoy exploring this site.


What have we learned so far?

Well, for one thing, there is a tremendous amount of money involved in Premier League football. This project analyzes data from only two teams in the Premier League; Liverpool FC and Manchester City FC. From the 2007-2008 season until the end of the 2017-2018 season, these two teams accounted for £5.7 Billion in declared revenues. At today’s exchange rate, that equates to $7.3 Billion US.

Manchester City2,998.451.8%Liverpool FC2,790.348.2%Manchester City2,998.451.8%Liverpool FC2,790.348.2%Manchester City2,998.451.8%Liverpool FC2,790.348.2%
Manchester CityLiverpool FCTotal Revenue LFC v MCFC - 2007/2008 to 2017/2018 (£ Millions)

What we can also learned is the significant rate of increase for annual revenues. The plot below shows the revenue for each club on a yearly basis.

2007/20082008/20092009/20102010/20112011/20122012/20132013/20142014/20152015/20162016/20172017/2018100150200250300350400450500
LFCMCFCLFC & MCFC Annual RevenueSeason(£ Millions)

On the transfer front, Liverpool FC have spent almost a £1 Billion acquiring players through the transfer market, while Manchester City have spent just under £1.4 Billion.

Manchester City1,391.0560.7%Liverpool FC900.9539.3%
Manchester CityLiverpool FCTotal Transfer Spend LFC v MCFC - 2008 to 2019 (£ Millions)

Hi there…

Another important aspect of financial resourcefulness is the ability to offer competitive wages. In addition to paying vast sums for player transfers, it is also necessary to fund the contracts associated with the players in question.

Similarly, a successful club will also employ an array of professional support teams such as sports medicine, counselling and analytics. These would typically be complemented by competitive and capable business teams across marketing, management and many other departments.

Conventional wisdom would imply that more expensive players will require higher wages and more talent across support and business functions would also require adequate compensation.

Data may exist which enables detailed analysis of wages, however, we have not yet found this. Filings with Company’s House detail aggregate wages only. Below is an illustration of Liverpool and Manchester wage bills over time and we operate on the assumption that all staff contribute to success whether on the pitch, in the backroom or indeed in the front office.

This makes for some interesting viewing. Manchester City pulled away from Liverpool significantly from 2009 season to 2014 season where there is convergence. The rising trend continues thereafter. Perhaps the overall change in salary expense is most intriguing. From 2006/2007 season to 2017/2019 (12 years) the salary expenses have risen from 32.4M and 67.6M for Manchester City and Liverpool respectively, to 225.9M and 232.7M.

This represents a 597% increase for Manchester City and 244% for Liverpool in just 12 years. Now that’s inflation!

There are people that enjoy reading balance sheets and income statements. We are not those people. However, we did manage to download account filings from Companies House and have started to examine some of the information contained therein.

Below you can see a plot of total profit/loss for Liverpool and Manchester City. This covers 2006/2007 season to 2017/2018. Some eye-opening numbers involved here.

Manchester City operated at a significant loss around the time of acquisition by Abu Dhabi United. It has taken some time to emerge from annual losses. From 2010 onwards, Manchester City shows a clear trend toward profitability.

Liverpool demonstrates a similar overall trend moving towards annual profits rather than losses.

The profit and loss numbers presented here include consideration of player sales and taxes. These are total profit/loss rather than operating profit/loss.